With 2018 in the books, Dynamic Securities Analytics, Inc. returns with our annual analysis of Suspicious Activity Reports (‘SARs’). This time we focused on SARs filed in 2018 by Depository Institutions, MSBs and Securities/Futures firms.
Something Old
Some SAR categories have been tried and true out-performers. The top three SAR categories for both Banks and Money Services Businesses (‘MSBs’) remain unchanged from 2017 to 2018. Depository Institutions top filing categories were 1) Suspicion Concerning the Source of Funds, 2) Transaction(s) Below CTR Threshold, and 3) Transactions with No Apparent Economic, Business or Lawful Purpose. MSBs saw Transaction(s) Below BSA Recordkeeping Thresholds in the #1 spot with Suspicious use of Multiple Transaction Locations coming in as #2. Contrary to the increase at MSBs, Banks saw Multiple Transaction Locations drop three spots with 8,000 fewer SAR filings from 2017 to 2018.
Securities/Futures saw the biggest shake-up in the leading SAR categories with Transaction with No Apparent Economic, Business, or Lawful Purpose moving up from the 5th spot in 2017 to #1 in 2018. Wire Fraud dropped from the top spot in 2017 to #3 in 2018 with a 12% decrease (about 600 fewer) SARs filed for that category.
Something New
The new SAR form implemented in 2018 included seventeen new options and one new category (Cyber Event).
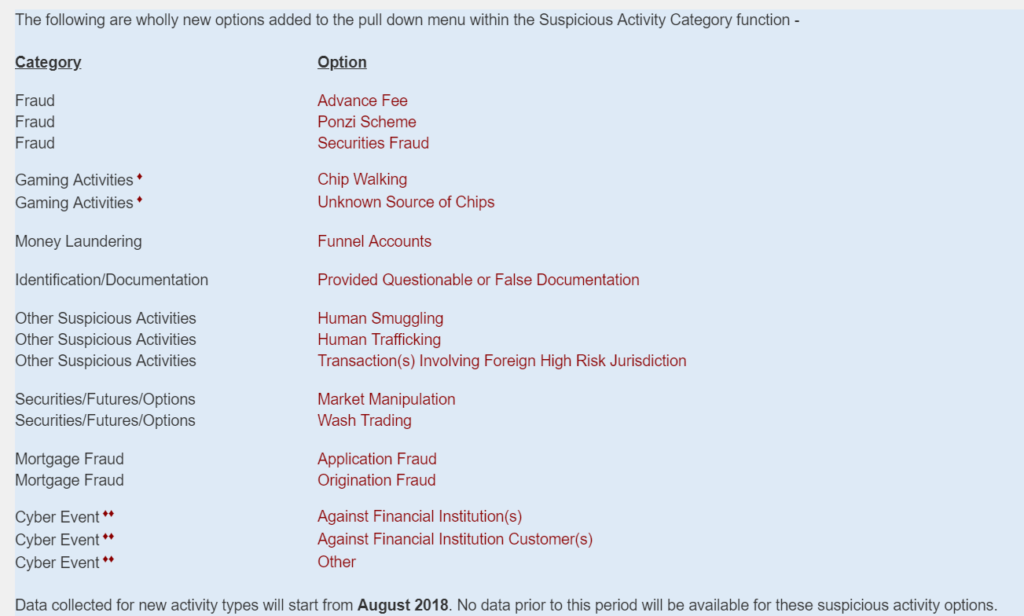
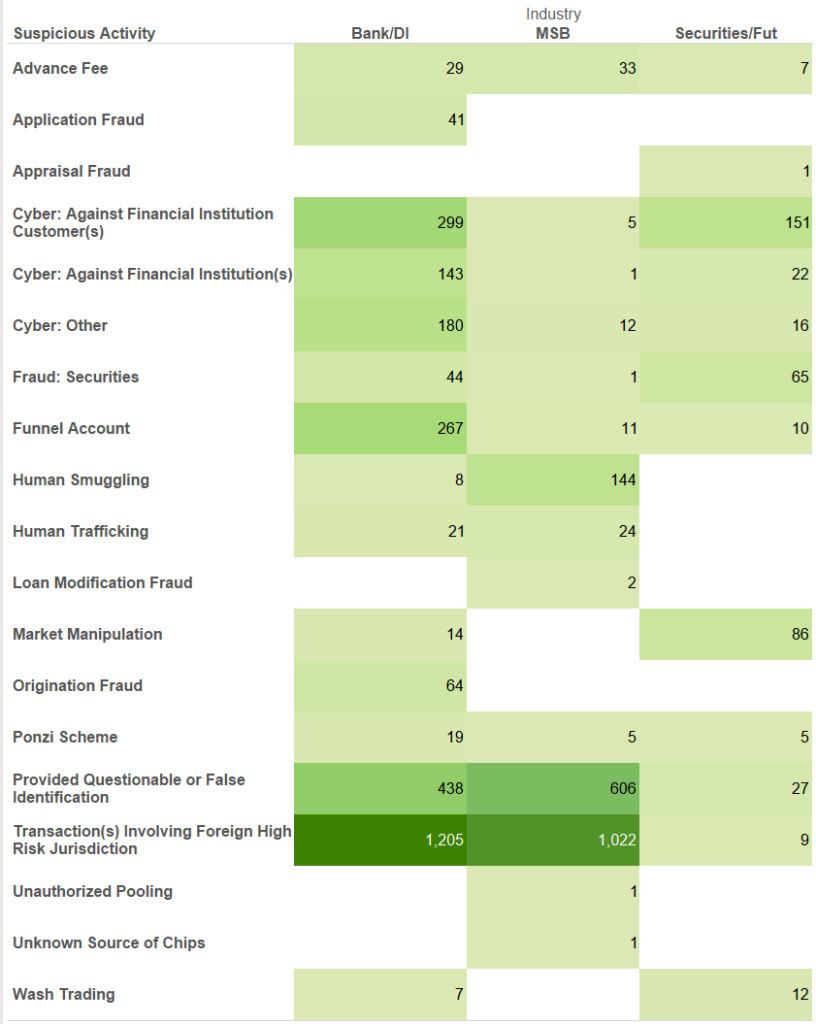
Banks and MSBs both reported Transaction(s) Involving Foreign High Risk Jurisdictions as the new option with the most SARs filed and Provided Questionable or False Identification held the second spot. Securities/Futures marched to its own drummer with Cyber Event: Against Financial Institution Customer(s) as the leading new category. All three industries reported more Cyber Events against Customers than against the Institution itself.
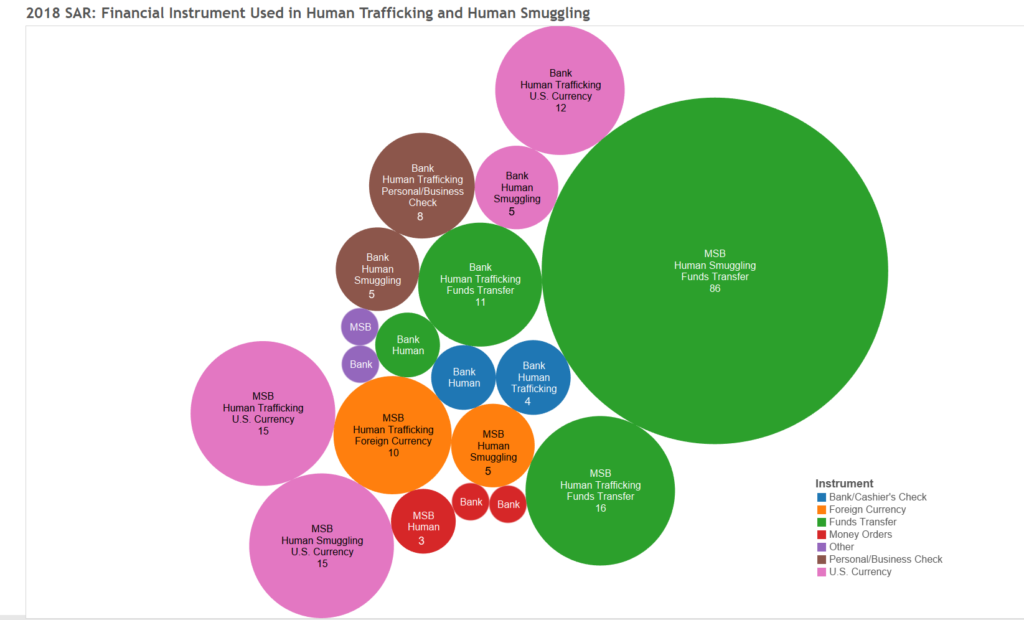
Human Trafficking and Human Smuggling SARs
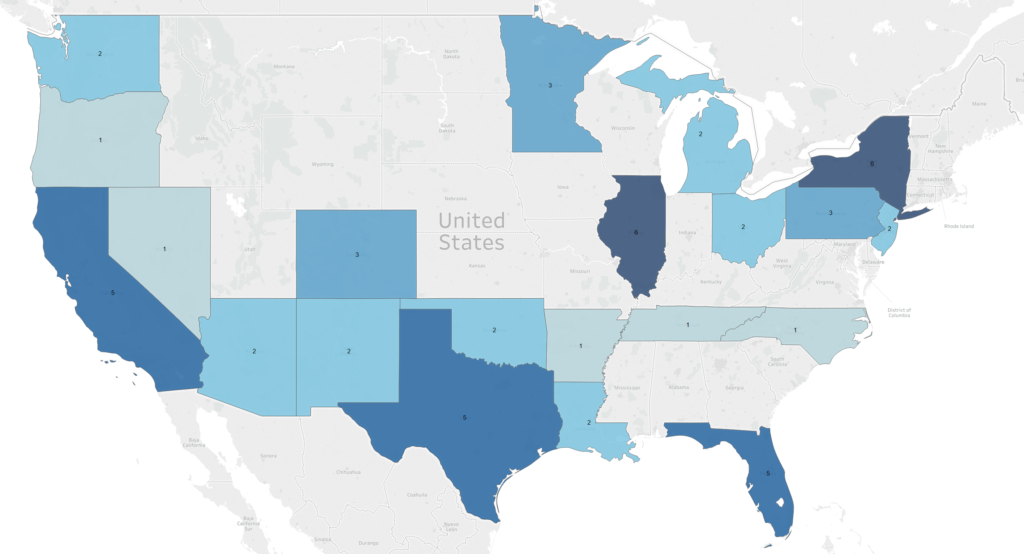
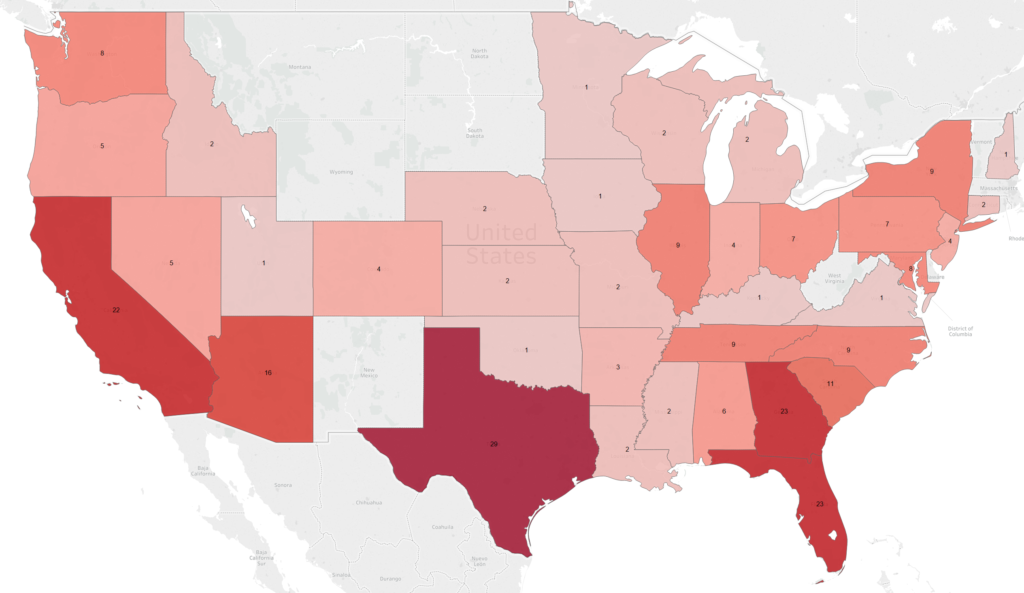
The long fought addition of Human Smuggling and Human Trafficking checkboxes to the SAR form show MSBs on the front-line of reporting. Top SAR locations for Human Smuggling are 1) Texas 2) Florida 3) Georgia 4) California and 5) Arizona. No surprises there. Banks reported more Trafficking than Smuggling SARs (21 vs 8) while MSBs reported 6 times as many Human Smuggling SARS than Trafficking (144 Smuggle vs 24 Trafficking).
Analysis by Dynamic Securities Analytics, Inc.
Analysis by Dynamic Securities Analytics, Inc.
SAR reporting for Human Smuggling and Human Trafficking will likely evolve as financial institutions gain more understanding of the methodologies involved. Thus far, Funds Transfers at MSBs is the leading financial instrument involved in Smuggling. By comparison over 47% of Human Trafficking involved US or Foreign Currency while only 15% of Human Smuggling involved cash.
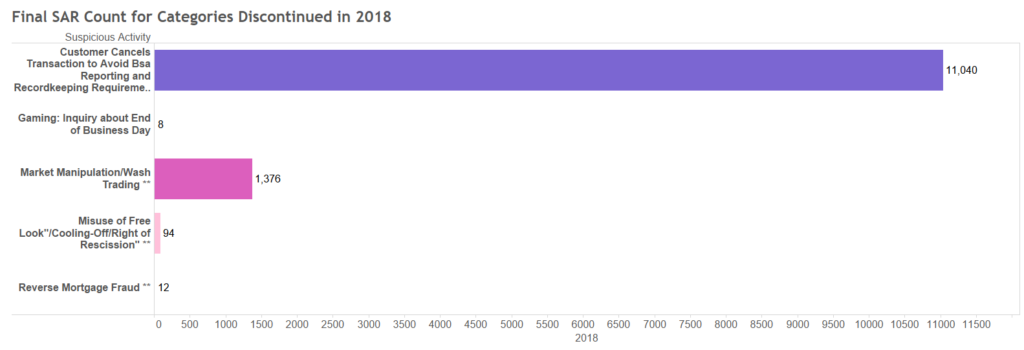
Say Goodbye
The new SAR form discontinued several former suspicious activity options.
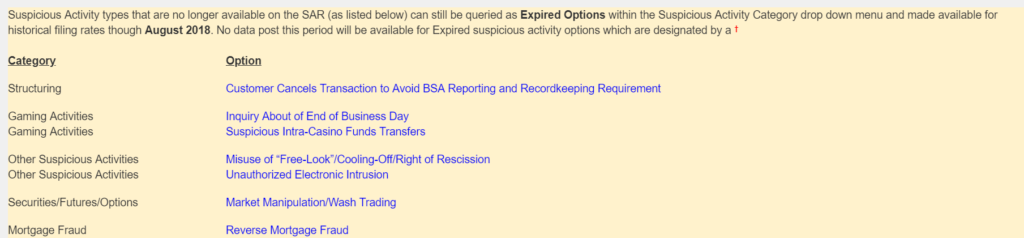
FinCEN reported SAR data for the expired options through August 2018. Although these categories are expired, most of the data should be captured in either new or edits to existing categories. For instance, while Customer Cancels Transactions to Avoid BSA Reporting and Recordkeeping Requirement rode off into the sunset, the edited category of Alters or Cancels Transactions to Avoid BSA Recordkeeping Requirement should encompass the SARs filed under the old option. In another instance, one category was broken into two separate categories. The old category Market Manipulation/Wash Trading was replaced with two new stand-alone categories… Market Manipulation and Wash Trading.
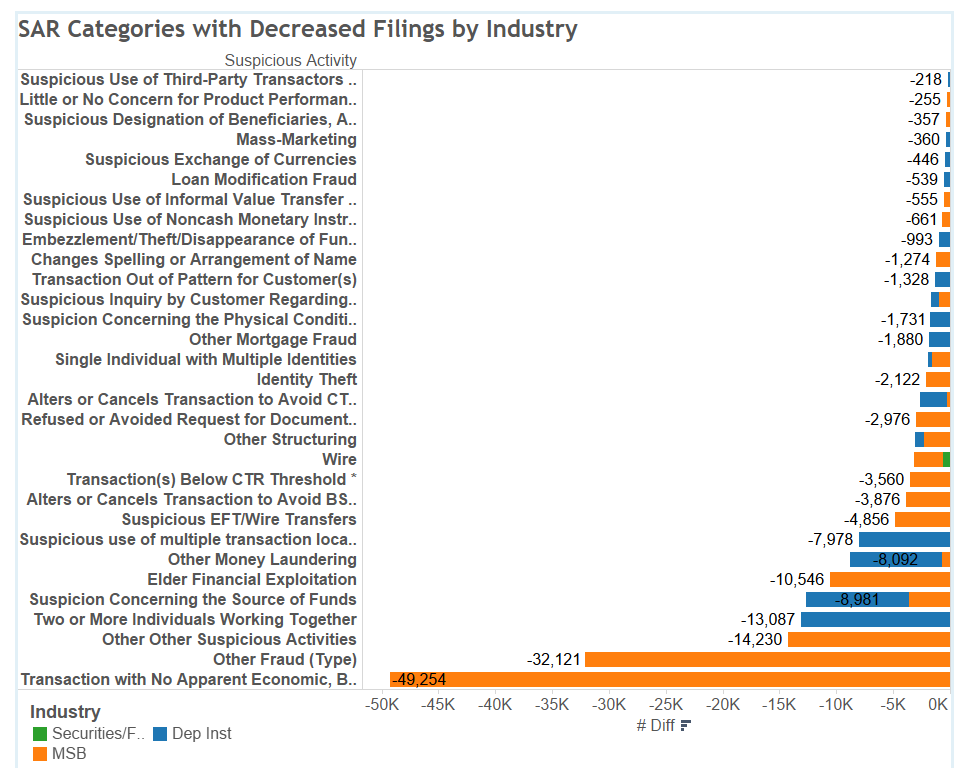
The Biggest Loser (of SAR Filings)
Here’s a run-down of some of the most surprising decreases in SAR filing categories from 2017 to 2018.
- MSBs filed 10,000 fewer Elder Financial Exploitation SARs which was a decrease of 35% from 2017 filing rates.
- MSBs filed 42% fewer (a decrease of 49,000) Transactions with No Apparent Economic Purpose SARs in 2018.
- Banks filings for Two or More Individuals Working Together dropped 16% (13,087 fewer SARs). Don’t worry, teamwork is not dead- MSBs saw an increase in the same category by 12,434 SARs.
- Securities Firms reported 607 fewer Wire Fraud SARs in 2018 than in 2017 while reporting increases in Check, ACH, and Credit/Debit Card Fraud.
Biggest Jumps in Filings
While it seems like SAR filings are always increasing there were some notable jumps:
- Banks increased their filings of Provided False or Questionable Document SARs by 49%, up by 27,238. The new SAR category Provided Questionable or False Identification garnered 438 bank SARs in the first few months it was required.
- Banks continue to file increasing numbers of Identity Theft SARs. Filings increased 43% from 2017 levels and are up 100% from 2013.
- MSBs are taking a closer look at corruption, both foreign and domestic. MSBs tripled the number of Foreign Corruption SARs from 58 in 2017 to 162 in 2018 and doubled the number of Domestic Corruption SARs from 50 to 114.
- Securities firms reported a 230% increase in Refused or Avoided Request for Documentation SARs.
Other Interesting Things
MSBs Discovering Unlicensed MSBs
Licensed and registered MSBs made it their mission in 2018 to root out unlicensed MSBs. SAR filings doubled from 633 to 1,275 for Unlicensed or Unregistered MSBs. One possible explanation is the crack-down on virtual currency exchanges as unlicensed MSBs.
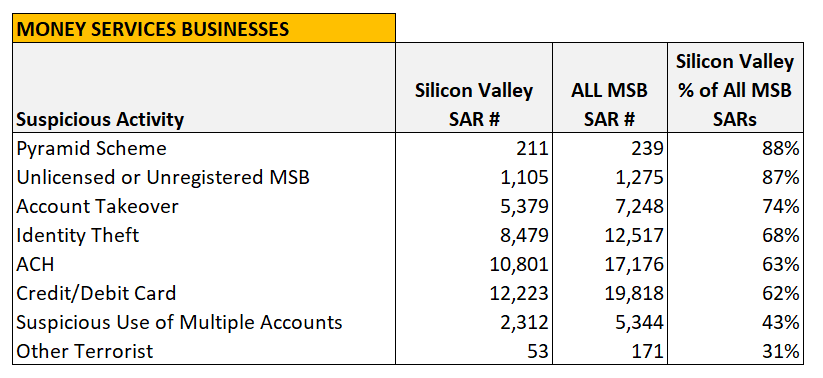
It wasn’t your corner convenience store MSB filing these SARs, it was MSBs located in Silicon Valley. In fact, 87% of the Unlicensed or Unregistered MSB SARs were filed by MSBs in Santa Clara County and San Francisco County, CA. Banks also filed an additional 500 SARs for this category but the geographic distribution was much more diverse. Which leads us to….
Silicon Valley MSBs
In 2017, I wrote about Social Media and Silicon Valley MSBs in relation to Pyramid Schemes:
Some social media companies offer their own payments systems (i.e. Facebook, Google). Other social media sites have embedded payments options via PayPal (another MSB with headquarters in Silicon Valley) or credit cards to facilitate in app transactions (ex.Twitter). There are also plug-ins that can be added to some social media apps that facilitate peer to peer payments (ex. WhatsApp). Finally, some pyramid schemes use social media merely as a way to advertise and recruit. For example, the Wing Network pyramid scheme used YouTube videos to promote the “financial success” of its top recruiters.
Silicon Valley again led the nation in 2018 filing Pyramid Scheme SARs (accounting for 46% of all pyramid scheme filings).
The two California counties supplied a majority of all MSB SAR filings in several categories and a large portion of SAR filings across all industries and locations. Silicon Valley MSBs accounted for 74% of MSB Account Takeover SARs and 1 out of 10 of all Account Takeover SARs. Similarly, Silicon Valley MSBs filed 13% of the nationwide total ACH Fraud SARs. And it may come as a surprise to some that Silicon Valley MSBs filed 13% of all Other Terrorist SARs in 2018.
Ponzi SARs: Loans and Check-Kiting 101
I previously wrote about KYC and Account Opening Red Flags in relation to the addition of the Ponzi category to the SAR form. With only 29 Ponzi SARs reported so far we have limited data to work with. Banks reported the SAR subject’s relationship to the bank as Borrower five times and Customer 18 times. Given the number of lawsuits banks have been drawn into by having a Ponzi schemer as a Customer it is encouraging that they have identified a decent number in a short amount of time.
The Borrower aspect is intriguing in that when Ponzi schemes start to crash, the organizer needs to find ways to keep the fraud going. Ponzi schemers turned to Home Equity Loans and Residential Mortgages to prop up the scheme as reported by the SARs Product category.
Another way to keep the scheme afloat is to buy more time. How does a Ponzi schemer do that? He engages in check-kiting. Checks have a float time that can be manipulated to inflate a bank balance at one bank and allow a schemer to make fake “interest” payments to investors. Banks reported Bank/Cashier Checks and Personal/Business Checks combined as the leading instrument type involved in suspected Ponzi schemes.
Check-Kiting: Floating worthless checks between accounts established at two or more institutions. The underlying premise of check kiting is the customer’s ability to gain access to deposited funds before they are collected
Red Flags that may indicate check
kiting can include[1]:
- a higher number of deposits- usually several per day
- a higher percentage of deposited funds coming from accounts under common control of the suspected kiter
- deposit and withdrawal activity conceal negative actual balances
- total dollar debits and credits are almost equal
- many deposit items drawn on the same bank(s) or many checks payable to the same payee
- checks written in “round” dollar amounts
_____________________________________________________________________________
Notes:
- 2018 SAR data was last updated by FinCEN on 10/31/18. All references to 2018 SAR counts are through 10/31/18 update which was the most recent data at the time of publication.
- 2017 SAR counts were adjusted to also cover a 10 month period in order to make year over year comparisons.
- Italics indicated options listed on SAR form (i.e. Suspicious Activity, Financial Instrument, etc.)
- See FinCEN FAQs for all the details on how SARs Stats are reported. For instance, filers may select multiple Suspicious Activity and Instrument options.
[1] https://www.interaction-training.com/twelve-factors-to-monitor-for-check-kiting/