Dynamic Securities Analytics, Inc (“DSA”) analyzed 2016 SAR filings reported in FinCEN’s SAR Stats database. DSA will be posting a series of articles on the analysis with today’s post providing a general overview and key findings.
Key Findings
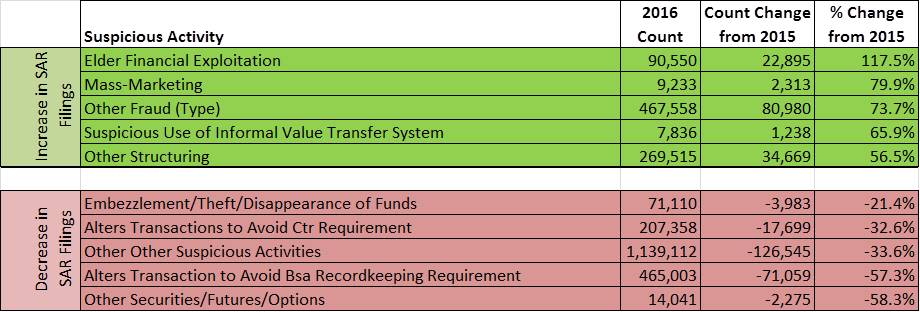
Elder abuse saw the largest jump in SAR filings with an increase of 117% over 2015 levels. Other large gains were seen in mass-marketing and suspicious use of informal value transfer system, otherwise known as hawala.
There was a 58% drop in “Other Securities/Futures/Options” suspicious activity. Large decreases were reported in both altering transactions to avoid BSA and CTR record keeping requirements, although increases in Multiple Transactions below BSA/CTR thresholds served as a counter-balance. This could be interpreted that money launderers are aware that changing a transactions to evade a threshold looks suspicious but they are still trying to sneak into the financial system by conducting multiple transactions.
Most Industries See Rising SAR Filings, Securities the Exception
SAR filings increased by 9.64% from 2015 levels across all industries. Loan and Finance companies saw the biggest gains with a 149% increase in filings while Depository Institutions (banks and credit unions) and MSBs both saw increases of 9%. The outlier was Securities/Futures firms which filed 1,504 fewer SARs than in 2015. This is a 8.79% decrease for securities firms despite the SEC’s warning that not enough securities firms file SARs and many firms file too few SARs. See DSA’s blog post “Why 35% of Broker/Dealers File Zero SARs” for more on this topic.
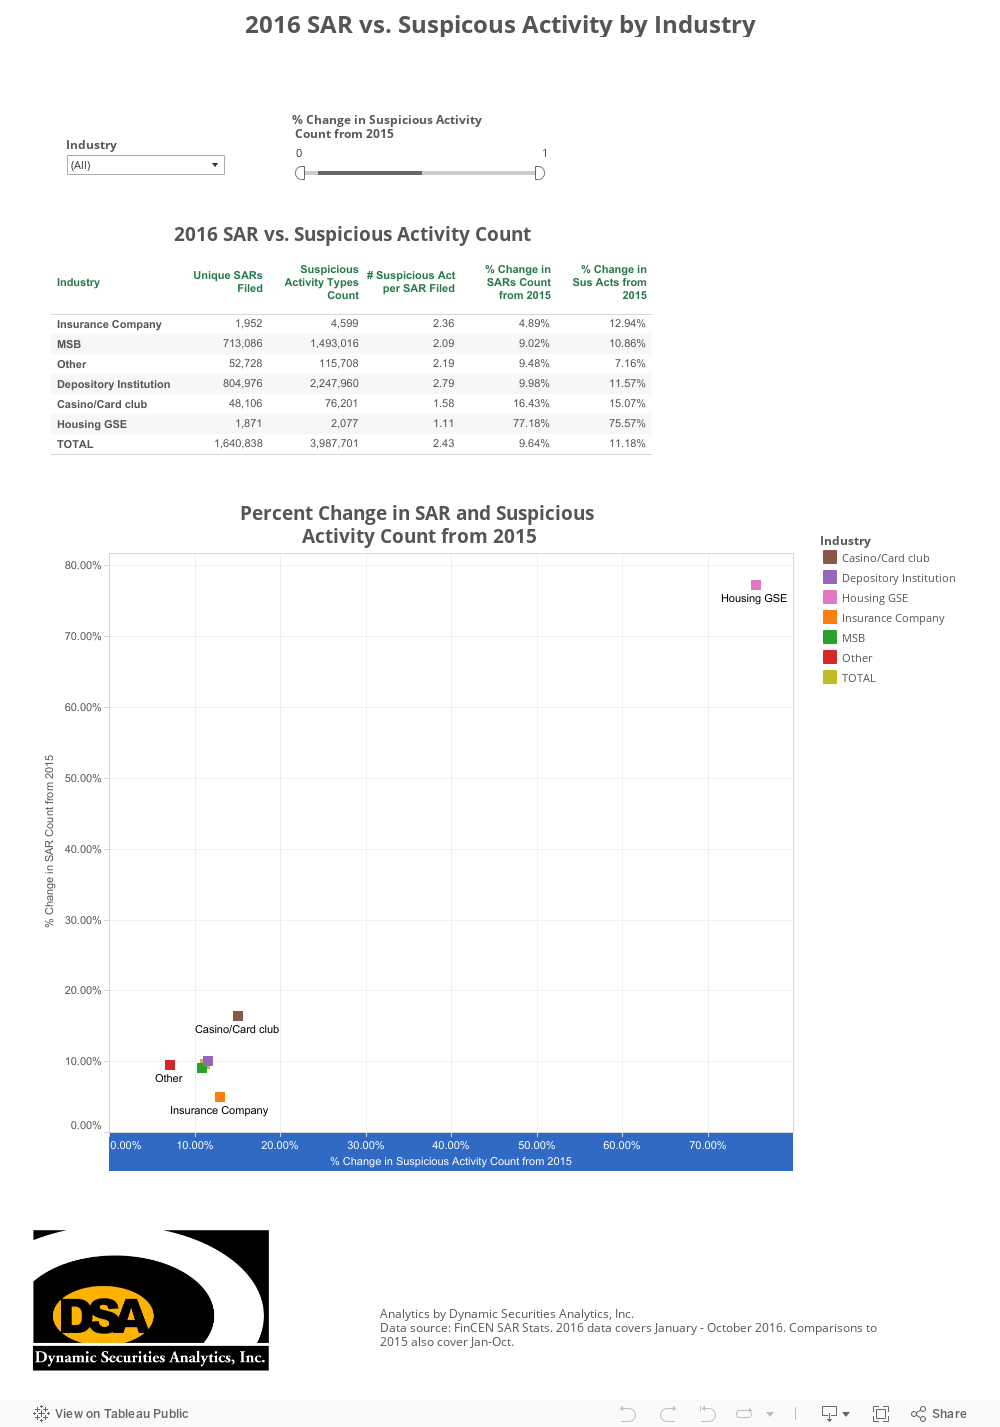
The interactive table below shows the number of unique SARs filed by industry and the number of Suspicious Activity types. The data can be filtered by industry and rate of change. Note that a SAR can include multiple suspicious activities. For instance, a bank could have filed one SAR which noted that an individual had suspicious documentation, altered a transaction to evade BSA requirements and was suspected of engaging in Elder Financial exploitation. In this example, there would be 1 SAR filed with 3 Suspicious Activity types. Depository Institutions have the highest Suspicious Activity count per SAR rate at 2.79 Activities per SAR, while Housing GSEs report the lowest rate at 1.11 per SAR.
DSA’s next post will examine which products and instruments were most commonly associated with various Suspicious Activities in 2016.
*2016 SAR data reported by FinCEN was through October 2016, any comparisons to prior years also covered January through October. All analytics prepared by Dynamic Securities Analytics, Inc.