The SEC filed a complaint on 12/20/2017 against Robert Shapiro the former CEO of the Woodbridge Group, alleging he operated a $1.2 billion dollar Ponzi scheme. Per the complaint:
Beginning in July 2012 through December 4, 2017, Defendant Robert H. Shapiro
(“Shapiro”) used his web of more than 275 Limited Liability Companies to conduct a massive
Ponzi scheme raising more than $ 1.22 billion from over 8,400 unsuspecting investors nationwide
through fraudulent unregistered securities offerings. Shapiro promised investors they would be
repaid from the high rates of interest Shapiro’s companies were earning on loans the companies
were purportedly making to third-party borrowers. However, nearly all the purported third-party
borrowers were actually limited liability companies owned and controlled by Shapiro, which had
no revenue, no bank accounts, and never paid any interest under the loans.
Maximizing Scheme vs. Evading Detection
There are two conflicting desires working against each other for Ponzi schemers: 1) maximizing the amount stolen 2) evading detection. A schemer may not start off aiming for longevity but longevity postpones a crash and a crash is when schemes are often detected. If the schemer consumes too much of the “investments” upfront for personal use, he is unable to meet income and redemption requests and the scheme quickly collapses.
Woodbridge Group
The SEC’s complaint include the figures below regarding the alleged Woodbridge scheme. These numbers can be used to illustrate the mathematics behind a Ponzi scheme.
a) Time Frame: July 2012 – December 2017 (5.5 years)
b) Total Principal Invested: $1,220,000,000
c) Annual Rate of Return Promised to Investors: 5%
d) Funds Used Personally by Alleged Schemer: $21,000,000
e) Operating Expense of Running Alleged Scheme: $172,000,000 (this includes $64.5M paid in sales commissions)
f) Principal Used to Buy Real Estate: $675,000,000 (SEC complaint alleged Shapiro was the beneficial owner of the real estate)
g) Principal Returned to Investors: $265,000,000
h) Interest Paid out to Investors: $103,000,000
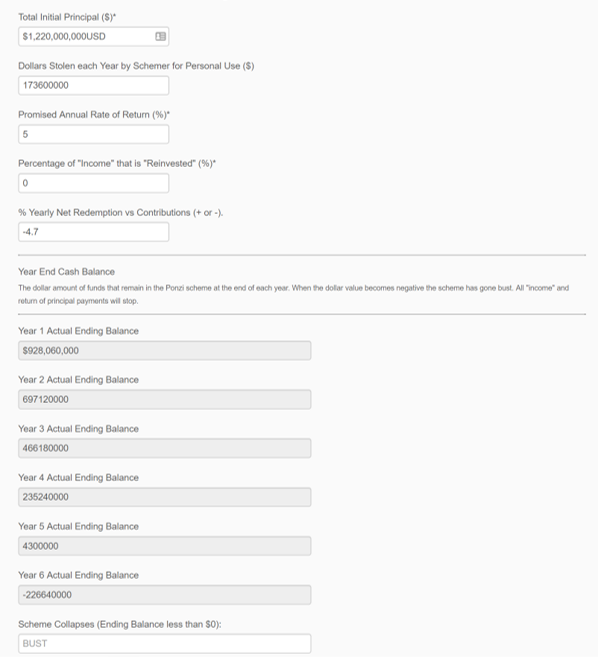
These numbers can be plugged into DSA’s Ponzi Scheme Calculator to determine how quickly a Ponzi scheme will collapse.
![]()
I combined d, e & f from above and divided by 5 for the number in “Dollar Stolen each Year by Schemer for Personal Use” field. The “Yearly Net Redemption vs Contribution” figure of -4.7% was calculated by dividing (g/b)/a. I’m happy to report that DSA’s Ponzi Scheme Calculator determined that the scheme would have collapsed between its 5th and 6th year, just like the alleged Woodbridge scheme did in real life.
DSA’s Ponzi Scheme Longevity Rules
Ponzi scheme longevity engenders trust, which leads to repeat investment and new investors and a larger pot to steal. Longevity adds to a schemers credibility.
Ponzi Scheme Longevity Rules:
–Encourage “reinvestment” of income. The less income the schemer pays out, the longer the scheme will last.
-Moderate the amount stolen each year. If he steals a smaller amount each year, the scheme will last longer and he will likely be able to steal more money overall.
-Discourage redemptions. Paying out principal to investors at a high rate will crash the scheme quickly. Therefore institute a large penalty for early redemptions or promise an even higher Rate of Return if the principal is reinvested instead of withdrawn.
-The Rate of Return promised should be higher than alternatives but not so high that paying out income will quickly bankrupt the scheme.
-Recruit new money. New money is key to maintaining a scheme for an extended period.
A read-through of the SEC complaint reflects most of DSA’s Longevity Rules. For instance, in paragraph 90 the SEC states “Woodbridge aggressively sought to avoid investors cashing out at the end of their terms and in fact touted achieving a 90% re-enrollment rate.”
Ponzi Scheme / AML Red Flags
Financial institutions should take note of paragraph 82 of the SEC complaint:
Woodbridge and Shapiro pooled FPCM Investors’ and Fund Investors’ investment funds into Fund Entity bank accounts and then further commingled them into a single Woodbridge or WSF operating account under Shapiro’s control. The commingling was extensive and resulted in transfers totaling approximately $1.66 billion and exceeded 10,700 transactions.
If history is our guide, the banks involved should expect to be hearing from regulators, bankruptcy attorneys and attorneys representing investors.
To learn more about Ponzi scheme Red Flags and transaction monitoring, please contact DSA and watch the ACAMS webinar “Dissecting the Inner Workings of Recent Ponzi Schemes.”

