Pyramid Scheme SAR Filings Spike
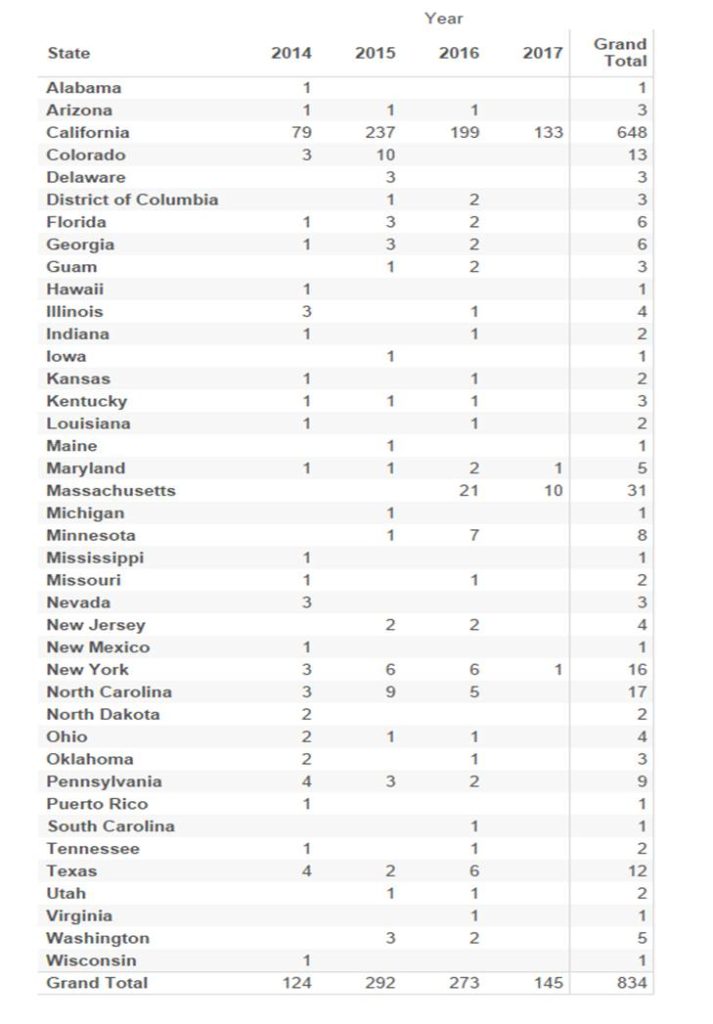
Dynamic Securities Analytics (“DSA’) has identified a trend in pyramid schemers utilizing social media platforms to execute their fraud. DSA analyzed FinCEN SAR Stat data and found a 340% increase in pyramid scheme Suspicious Activity Report (‘SAR’) filings by Money Services Businesses (‘MSB’) in monthly filing rates in 2017 versus 2016. California MSBs account for 92% of pyramid scheme SAR filings in the country so far in 2017, compared to 64% in 2014. Moreover, California MSBs filed more pyramid SARs in January and February 2017, than all MSB scheme pyramid SARs for every other state in the country for 2015 and 2016 combined.
Silicon Valley: Pyramid Scheme Epicenter
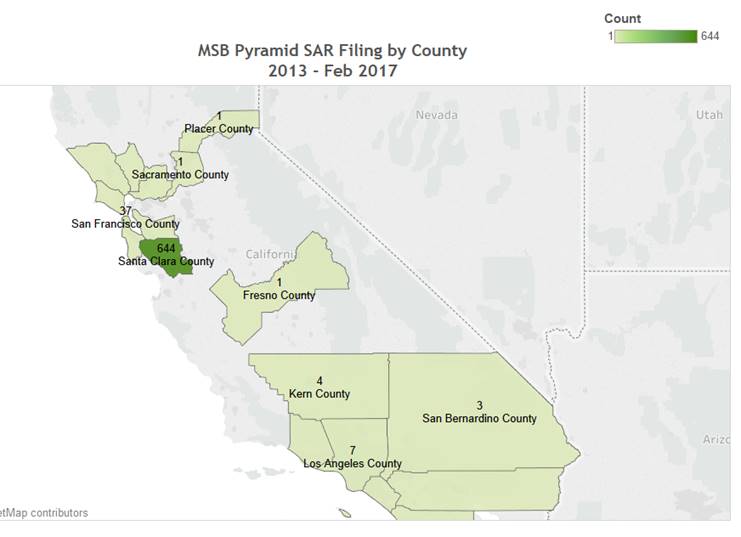 In 2016, California MSBs reported on average 16 pyramid schemes each month. In the first two months on 2017, that number has shot up to 66 pyramid schemes each month. The increase is not spread evenly across the state, it is concentrated in Silicon Valley. For instance, Santa Clara and San Francisco counties accounted for 97% and 99% of all pyramid scheme SARs filed by MSBs in California in 2016 and the first two months on 2017, respectively.
Popular social media companies such as Facebook and Google have related businesses registered as MSBs with business addresses in California. The related MSBs process payments made via the social media sites. While it is encouraging that the MSBs are detecting and reporting suspected pyramid schemes, the SAR numbers indicate that the push toward social media payment platforms did not come without a price.
Comparatively, the number of pyramid scheme SARs filed by banks decreased in 2015 and 2016 from 2014 filing levels. The filing increases by tech-related MSBs and decreases by traditional banks suggest that social media payment platforms have been embraced by fraudsters seeking to employ new methods to defraud victims. 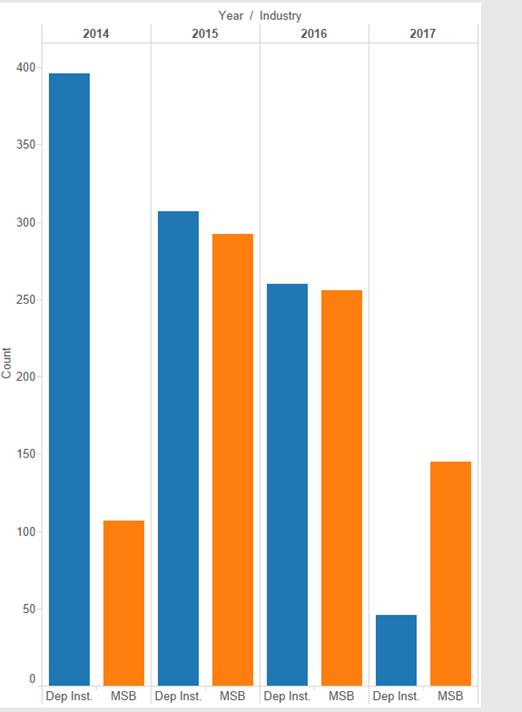
Pyramid Schemes + Social Media = A Match Made in Heaven
Pyramid schemers rely on older participants to recruit newer participants to propagate the scam. Pyramid scheme participants understand that part of the revenue they “earn” is from recruiting new members. Social media is the perfect venue for pyramids given the peer to peer recruitment aspect. The Lead pyramid schemer benefits from the trust and pre-existing relationship between participants. Pyramid schemes often have a short lifespan and the viral nature of social media helps the schemer reach a large audience quickly.
The virtual aspect of online pyramid schemes makes it easy for a Lead Schemer to quickly launch a new scheme or re-brand a scheme when an old one collapses. Anonymity offered online allows pyramid schemers to hide behind a screen name while regulators and/or social media companies play cat and mouse with the fraudster.
Some social media companies offer their own payments systems (i.e. Facebook, Google). Other social media sites have embedded payments options via PayPal (another MSB with headquarters in Silicon Valley) or credit cards to facilitate in app transactions (ex. Twitter). There are also plug-ins that can be added to some social media apps that facilitate peer to peer payments (ex. WhatsApp). Finally, some pyramid schemes use social media merely as a way to advertise and recruit. For example, the Wing Network pyramid scheme used YouTube videos to promote the “financial success” of its top recruiters.
Links to news reports of pyramid schemes with social media aspect:
The Meteoric Rise of the Worlds Largest Ponzi Scheme in Nigeria
Pyramid Scheme in India with Facebook and Twitter Aspects
Pyramid Schemes using WhatsApp
“Gift Exchange” Pyramid Schemes on Facebook
Peer to Peer Payments Schemes in Nigeria
Wine Pyramid Scheme on Social Media
__________________________________________________________________________________________
Notes
1) All 2017 data is only for January and February 2017 (two months). All other yearly data covers the full year.
Raw data from FinCEN SAR Stats as of March 29, 17. Analysis and graphics prepared by Dynamic Securities Analytics, Inc.
2) Explanation of State and County Data from FinCEN.gov:
States/Territories – The geographic distributions of data generally reflect where the transaction activity occurred. FinCEN initially pulls data as entered in fixed-field 68 (State of branch or office where activity occurred) within Part III (Information about Financial Institution Where Activity Occurred) of FinCEN Form 111. If no entry was made in fixed-field 68, then the item entered in fixed-field 59 (Financial Institution’s Permanent State Address) is counted accordingly. Absence of an entry in fixed-field 68 may reflect a financial transaction as having occurred at the firm’s headquarters or permanent address rather than a branch or office location. In instances where both fields 59 and 68 are left empty or contain entries that do not apply, a designation of Unknown/Blank is given. Numeric discrepancies between the total number of filings and the combined number of filings of states and/or territories are a result of multiple locations listed on one or more Suspicious Activity Reports. Numeric SAR data for transaction activity locations involving an APO (Army/Air Post Office), DPO (Diplomatic Post Office), or FPO (Fleet Post Office) is made available under a consolidated group: APO/DPO/FPO.
County/Metro & Micro Area – Provides a more granular perspective of detail at the local rather than broader state level by breaking down summaries of SAR data by county/parish and both Metropolitan (Metro) and Micropolitan (Micro) Statistical Areas. County Data: Counties are defined by zip codes as provided by the filing institution indicating where the suspicious activity occurred. Note: Instances may exist where zip codes correspond to more than one county.

