Summary: Crypto Suspicious Activity Reports (SARs) on a SAR per User Rate greatly exceeded other investment products. Crypto SARs outpace long established industries such as Gaming and Securities. The average transaction dollar value for a crypto-related SAR in 2021 was $1 million vs $19,300 for MSBs in 2010.
Industry Comparison of Suspicious Activity Reports
Some financial industries have been in existence for centuries or millennia. Gambling has been traced back to ancient civilizations and the first casino opened during the Renaissance. The 1600’s saw the creation of the first stock, stock exchange, and government bond.
Bad actors have had centuries to devise ways to exploit securities and gambling for financial crime and to launder funds.
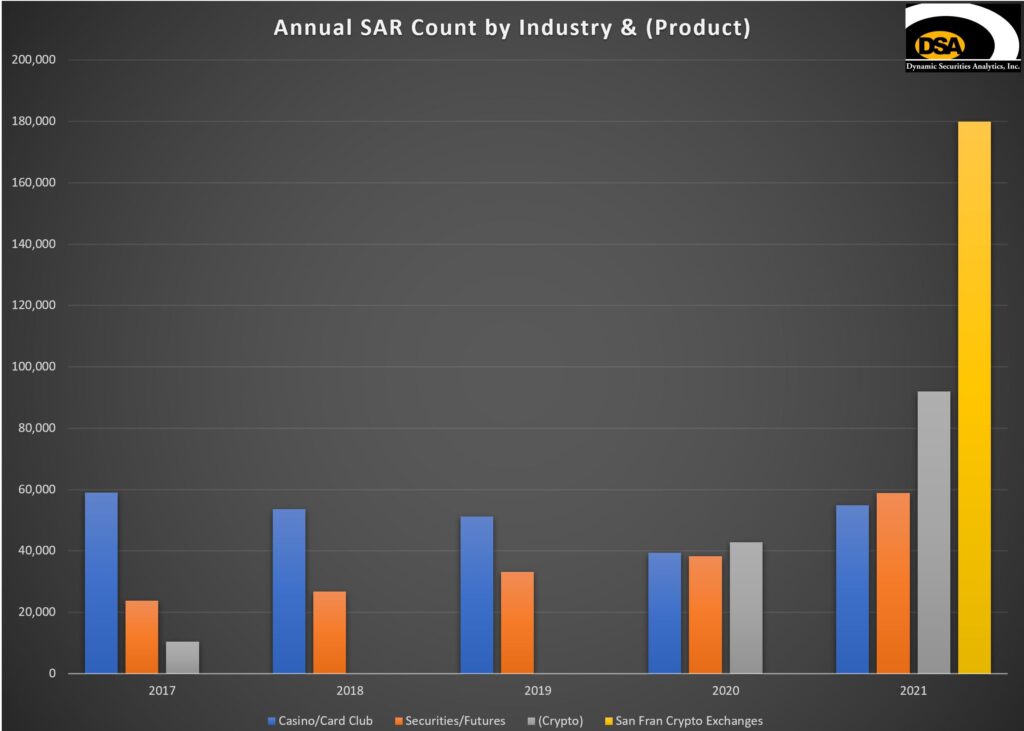
Bitcoin came into existence in 2009. Despite cryptocurrency only existing for thirteen years, there were more SARs filed related to crypto assets in 2021 than for the Securities or Gaming industries.
Last year there were 54,937 SARs filed by Casinos/Card Clubs and 58,951 SARs filed by Securities/Futures firms. FinCEN reported that over 92,000 Crypto-related SARs were filed in 2021.
DSA’s analysis estimated that cryptocurrency exchanges located in San Francisco filed approximately 180,000 SARs in 2021.
Crypto Suspicious Activity Report Dollar Value Comparison
FinCEN stated that the 92,000 crypto-related SARs filed in 2021 reflected over $92 billion in transactions. Therefore, the average 2021 cryptocurrency SAR would have reported $1 million in suspicious transactions.
The GAO found that in 2019:
FinCEN received approximately $119 billion in suspicious activity reporting associated with CVC taking place wholly or in substantial part in the United States. By industry measures, this would equate to approximately 11.9% of total CVC market activity being relevant to a possible violation of law or regulation.
Federal Register/ Vol 85, No. 247/ December 23, 2020
FinCEN has not disclosed the number of crypto-related SARs filed in 2019. If we instead use the 2020 SAR count, the average transaction value for the 2019 cryptocurrency SARs was $2,781,543.64.
Unfortunately, the average SAR dollar value for products and industries is rarely disclosed by FinCEN. In 2010, FinCEN reported that the average dollar value for a MSB SAR was $19,3000. Similarly, the average dollar amount per Casino SAR filed in 2011 was $27,600.73.
The total SAR transaction dollar amount reported by Casinos from 2004 through 2011 was $1.17 billion.
The dollar value of crypto-related SARs filed in 2019 was 100 times the dollar value of all SARs filed by casinos over eight years.
More recent numbers would be helpful to make better comparisons.
SAR Financial Product Comparison
We can also compare SAR stats for cryptocurrency against other financial products. As a starting point, let’s look at the usage of various financial products by US adults.
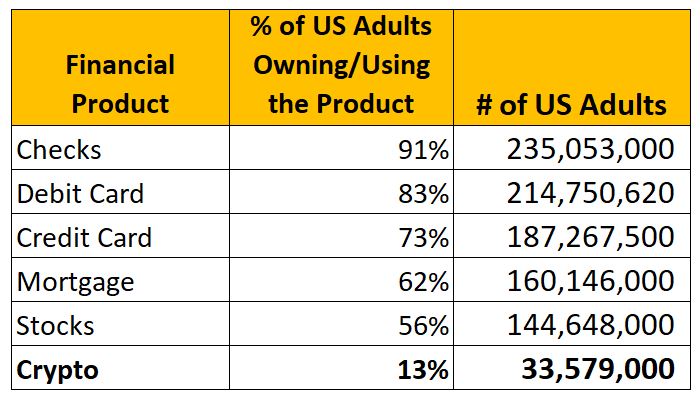
Some financial products are more widely adopted by US adults than others. For instance, 91% of Americans use Checks and only 73% use Credit Cards.
Where it gets difficult is comparing the frequency or intensity of financial product use. For example, most Americans have multiple Credit Cards but only one Mortgage. Alternatively, a Stock owner may transact once per year but use a Debit Card once per day.
The usage/ownership rates listed above are for US adults, not businesses or entities. Yet businesses and legal entities are often used to launder funds. Foreign persons and entities also seek out the US financial system to launder funds and commit financial crime.
Despite these challenges, it is worthwhile to look at financial product adoption versus SAR reporting levels (which I will coin as the “SAR per User Rate“).
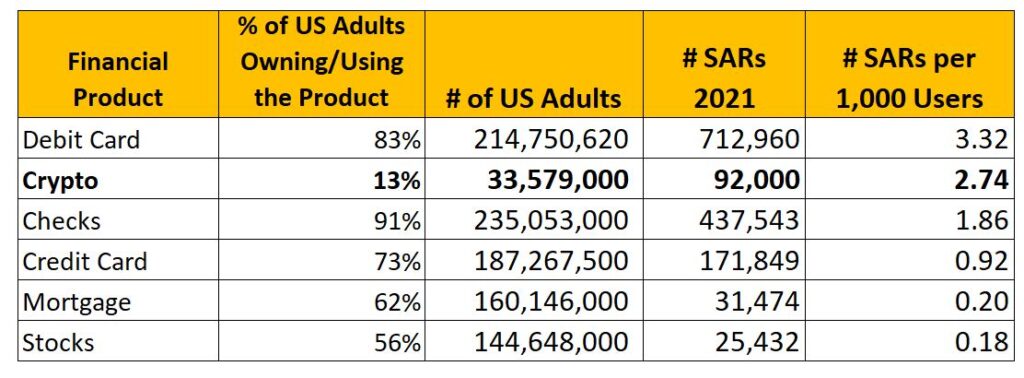
Starting at top right, we see that for every 1,000 US adult users of Debit Cards, there were 3.32 SARs filed in 2021. In contrast, for every 1,000 US adult owners of Stocks there were 0.18 SARs.
Keep in mind that 56% of Americans own Stocks and 83% report using Debit Cards. The SAR Per User Rate for Debit Cards was 19 times greater than for Stocks.
Therefore, it is reasonable to conclude that bad actors prefer to use Debit Cards over Stocks to facilitate their crimes. Similarly, we can infer that Debit Cards have attributes that make it more attractive than Stocks to fraudsters and money launderers.
Crypto Suspicious Activity Reports vs Traditional Investment Products
Crypto assets are often described as “investments” or as an “asset class”. Yet the SAR per User Rate for Crypto is markedly higher than for traditional investment products. There were 2.74 SARs per 1,000 Users of Crypto versus 0.18 SARs for Stocks. Note that Stocks had a much higher ownership rate (56%) than Crypto (13%) in 2021.
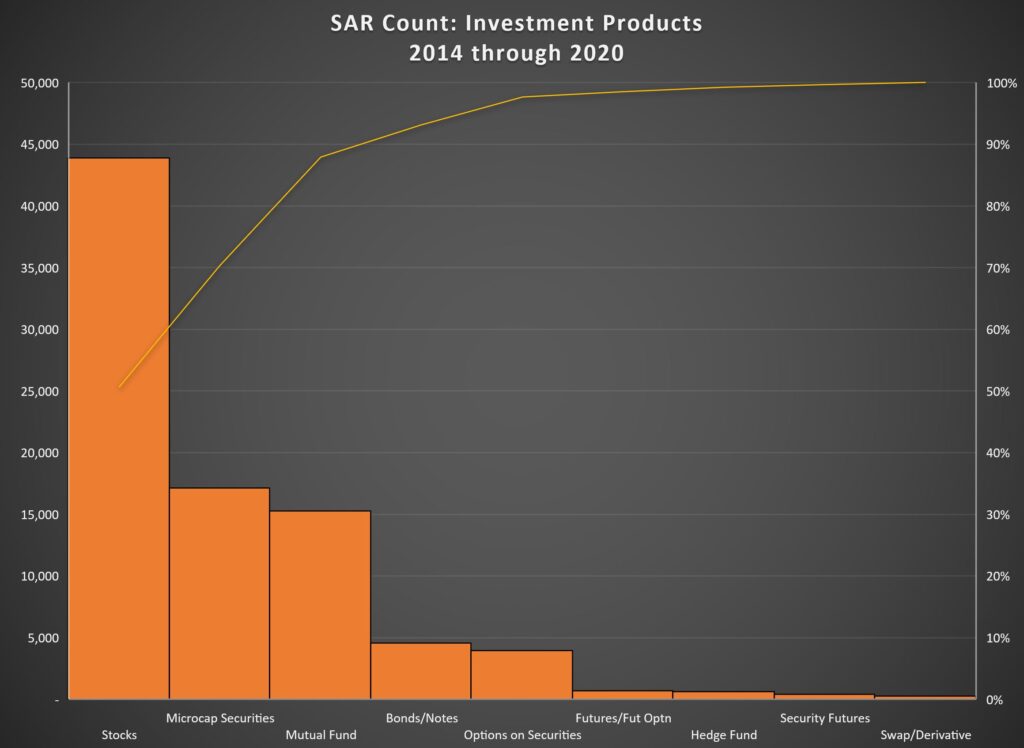
Even without adjusting for financial product usage, Crypto SARs dwarfed investment product SARs.
There were more Crypto SARs filed in 2021 than for all securities/investment products from 2014 through 2020.
This leads me to conclude that bad actors prefer to commit financial crime and launder funds via cryptocurrency rather than through traditional investment products. Additionally, there are features of cryptocurrency, or its regulatory environment, that are more attractive to bad actors than stocks and mutual funds.
Crypto vs Cash SARs
If we assume that all US adults use cash (US Currency) then there were 5.34 SARs filed per 1,000 US Currency users. While the SAR per User Rate was greater for US Currency than Crypto in 2021, it may not stay that way for long.
Crypto SAR filings shot up by 115% from 2020 levels. If Crypto SAR filing rates continue to double year after year, even with adoption growing moderately, it will only take a year or two for the Crypto SAR per User Rate to surpass the US Currency rate.
Attributes, Attributes, Attributes
Bad actors weigh the attributes of financial products when considering its use for either financial crime or to launder illicit proceeds.
- Can the financial product move a lot of money at once?
- Can the financial product move value across international borders?
- Can the transaction be completed quickly?
- Can the transaction be reversed?
Anonymity is just one of many factors considered. Checks, credit cards, debit cards and scores of other financial products are not anonymous, yet millions of SARs have been filed involving these products.
Dismissing cryptocurrency as a useful tool for criminals and money launderers just because some transactions are pseudonymously recorded on the blockchain is not born out the crypto SAR filing data.
Want more Crypto Suspicious Activity Report Insights?
Read DSA’s 2021 SAR Insights.
Read DSA’s analysis on Unregistered Cryptocurrency Exchange SARs.
Read DSA’s blog “Cryptocurrency SARS: What do we know?”
