“Missing SARs” Leads to Continuing SARs and Corrected/Amended SARs
I teamed up with Jim Richards, Founder & Principal of RegTech Consulting LLC to try to answer the question of why FinCEN reported two widely different totals for the number of Suspicious Activity Reports (‘SARs’) filed in fiscal year 2022.
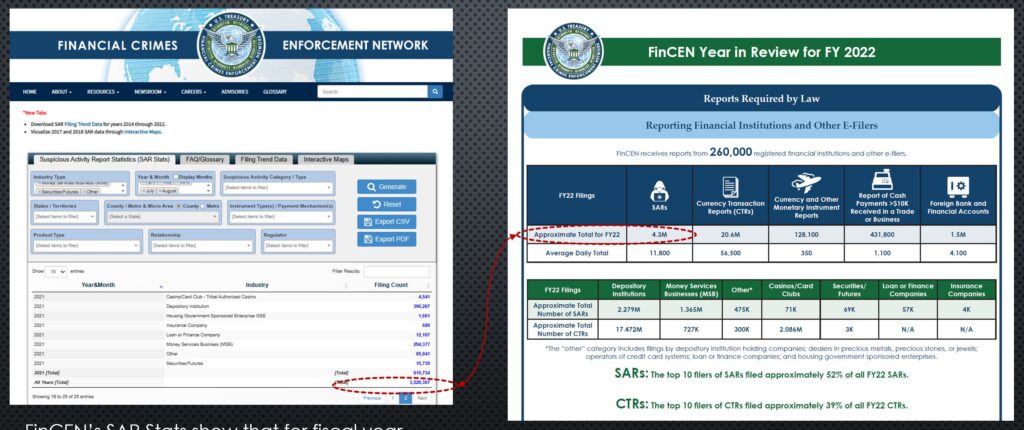
FinCEN’s Year in Review for FY2022 reported 4.3 millions SARs while FinCEN’s SAR Stats shows 3.5 million SARS filed in FY2022. This is a difference of almost 800,000 SARs.
SAR Stats Reports SARs with Unique BSA Identification Number
FinCEN’s SAR Stats FAQ/Glossary notes:
The number of SARs filed is “based on the BSA Identification Number of each record within the SAR system. The BSA Identification number is a unique number assigned to each SAR submitted.
What is a BSA Identification Number?
FinCEN publishes a User Guide for the XML schema for electronically submitting SARs. Each initial or original SAR submitted is assigned a unique BSA Identification Number.
There are three other types of SARs:
- Corrected/amended reports
- Continuing activity reports
- Joint reports
Page 142 of the User Guide explains that for corrected/amended SARs, “if known, the prior report’s BSA Identifier (BSA ID) must be entered in field 1e. If the prior report’s BSA ID is unknown, field 1e should be zero-filled.”
The User Guide explains on page 9 that when filing a corrected/amended and/or continuing activity SAR, the filer should include the prior SAR’s BSA Identifier.
There are two things to be taken from this. First, corrected/amended and continuing activity SARs do not have their own BSA Identification Number, so are not included in FinCEN’s SAR Stats. Second, we don’t know the breakdown between corrected/amended SAR, and continuing activity SARs.
Continuing Activity and Corrected/Amended SARs
FinCEN’s Year in Review for FY2022 shows that approximately 4.3 million SARs were filed.
Meanwhile, SAR Stats shows that 3.5 million SARs were filed for the same period. There is a difference of 800,000 SARS between the two sources.
We wondered:
- Were there 800,000 corrected/amended and/or continuing activity SARs filed in FY22?
- If so, how many were corrected/amended SARs?
- How many were continuing activity SARs?
Answers may lie on a FinCEN publication from May 2020 that looked at SARs filed in 2019.
Federal Register Data on Continuing SARs
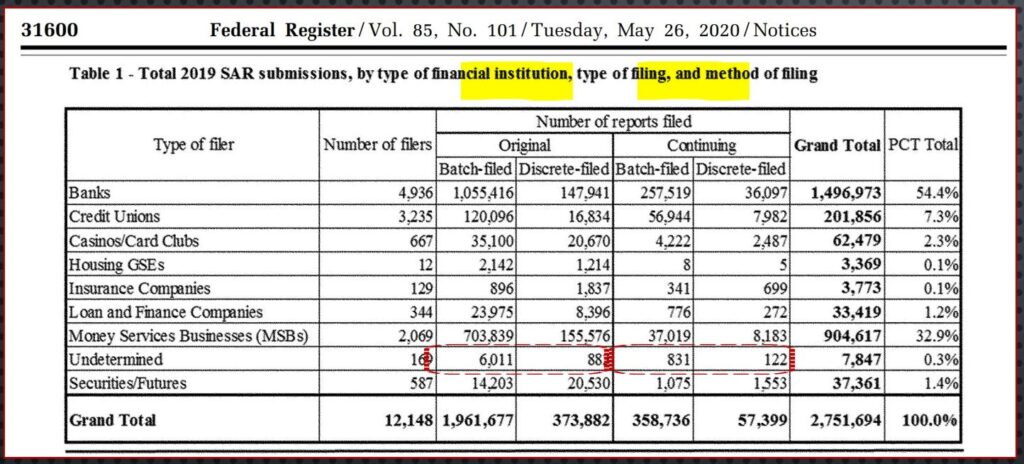
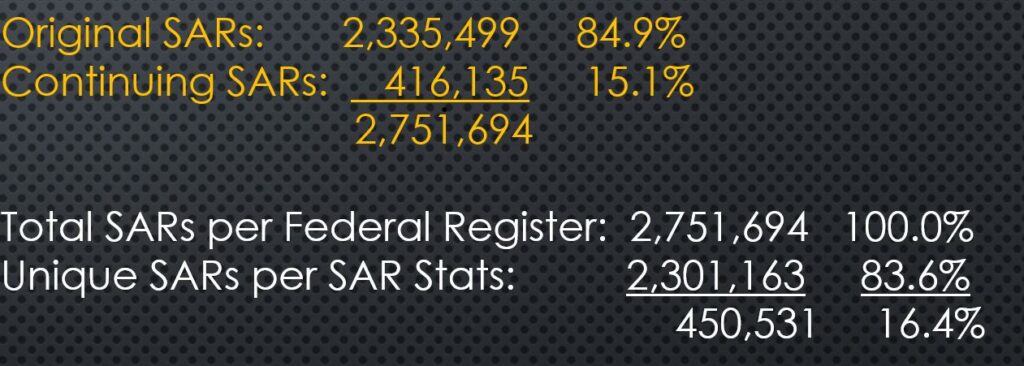
This Federal Register notice from May 26, 2020 indicates that a total of 2,751,574 SARs were filed in 2019, and that 2,335,449 of these (1,961,677 + 373,882) were original SARs. The notice also shows that there were 416,135 “continuing” SARs filed in 2019. This means that 15.1% of all SARs were continuing SARs.
On the other hand, SAR Stats shows that 2,301,163 SARs (with unique BSA Identifiers) were filed in 2019. There is a difference of 450,531 SARs between the Federal Register notice and SAR Stats (2,751,694 minus 2,301,163). We calculated that Unique SARs accounted for 83.6% of all SARs.
However, the Federal Register notice does not mention whether corrected/amended SARs were included as part of the original SARs or as part of the continuing SARs, or at all.
How Many Corrected/Amended SARs are there?
FinCEN’s marijuana SAR data may provide some clues. FinCEN noted in the September 2023 marijuana-related SAR data that corrected reports comprised 4% of all MRB SARs.
Does a 4% corrected SAR rate hold across other types of SARs?
Let’s go back to the 2022 SAR statistics: the SAR Stats shows 3,529,367 SARS with unique BSA Identification Numbers. The 2022 Year in Review shows 4.3 million SARs.
That is a difference of 770,633 SARs, or 17.9 percent of 4.3 million.
Continuing SARs Estimation Methods
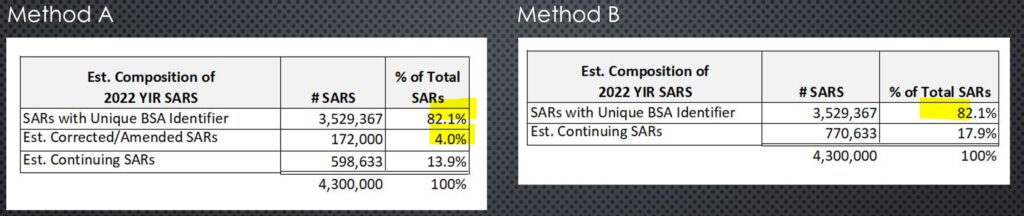
Under Method A, we start with the assumption that 4 percent of the total number of SARs – 4.3 million SARs – are corrected SARs. The difference – 598,633 SARs- are continuing activity SARs. This difference of 13.9% continuing activity SARs is very close to the 2019 data that showed 15.1% of SARs were continuing activity SARs.
Under Method B, if we do not break out corrected SARs, then 17.9% were continuing activity SARs.
Continuing/Corrected SARs by Suspicious Activity Category
We also tried to determine how many continuing and corrected/amended SARs were filed via the detail on suspicious activity categories.
FinCEN data includes eleven categories of suspicious activity:
- Cyber event
- Fraud
- Gaming activities
- Identification documentation
- Insurance
- Money laundering
- Mortgage fraud
- Other suspicious activity
- Securities/futures/options
- Structuring
- Terrorist financing
We filtered on each of the eleven suspicious activity categories to determine how many SARs reported each category.
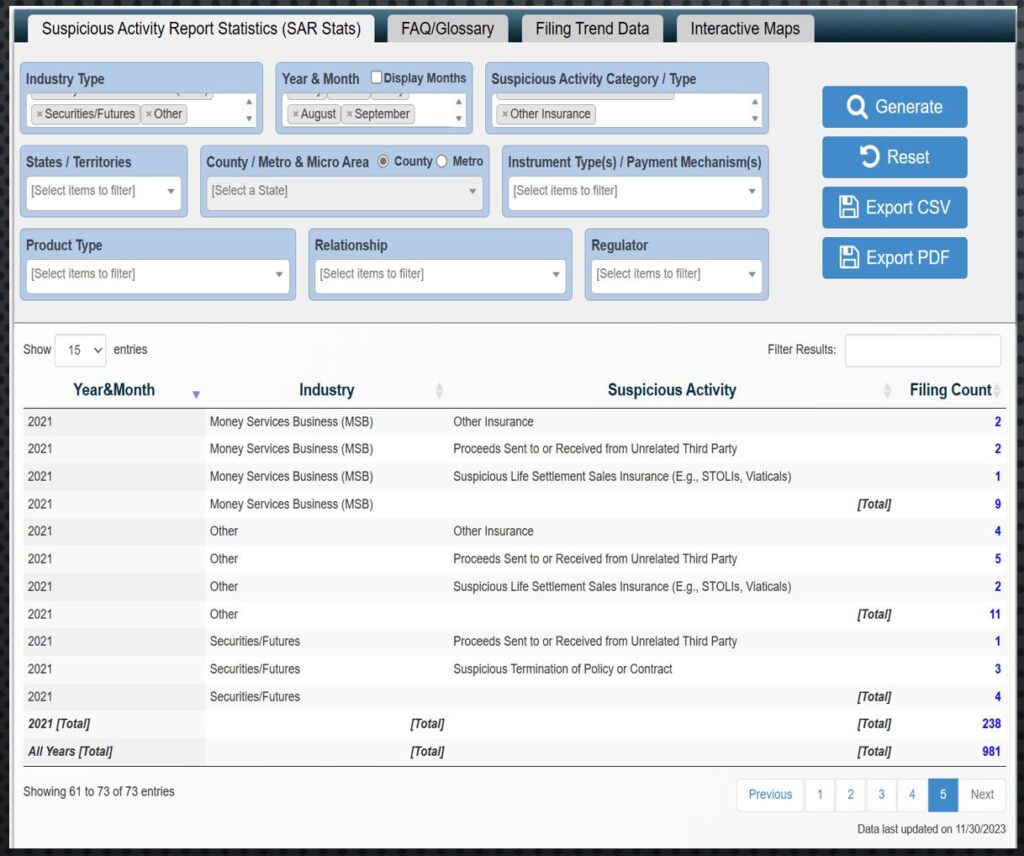
For example, according to SAR Stats, in fiscal year 2022, there were 981 SARs that reported “insurance” as a suspicious activity category. Note that a SAR can report more than one category of suspicious activity.
FinCEN’s 2022 Year in Review also included data on the eleven SAR suspicious activity categories. We totaled both the SAR Stats data and the Year in Review data and compared them:
The SAR Stats report 9.2 million categories in the 3.5 million SARs with unique BSA Identification Numbers. The Year in Review reports 11.4 million categories in the 4.3 million SARs filed. This difference is approximately 19.5 percent.
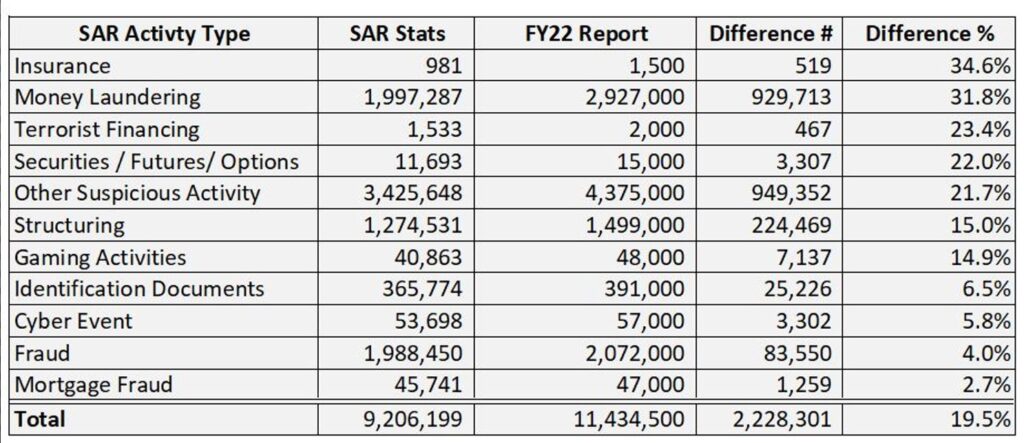
Comparing the Year in Review with the SAR Stats by SAR category, we see where the differences are. Continuing activity (and potentially corrected/amended) SAR rats varied widely by suspicious activity.
For example, “insurance” had a difference of 34.6% while “mortgage fraud” had a difference of 2.7%.
Does a larger percentage of potentially Continuing SARs indicate:
- slower moving crimes
- less certainty by the filing institution
- suspicious activity that the FI feels does not warrant immediate closure of the account
- requests by Law Enforcement to keep the account open
- or something else?
From this, we still cannot determine how many of the 4.3 million SARs filed in fiscal year 2022 were continuing activity SARs and how many were corrected/amened SARs.
Only FinCEN can determine this.
_______________________________________
Want more SAR Insights?
SAR Insights: Drug Trafficking SARs
SAR Insights: Kleptocracy Suspicious Activity Reports
Cryptocurrency SARS: What do we know?
Dynamic Securities Analytics, Inc. provides litigation consulting to help clients successfully navigate disputes involving securities, cryptocurrency, and money laundering.
