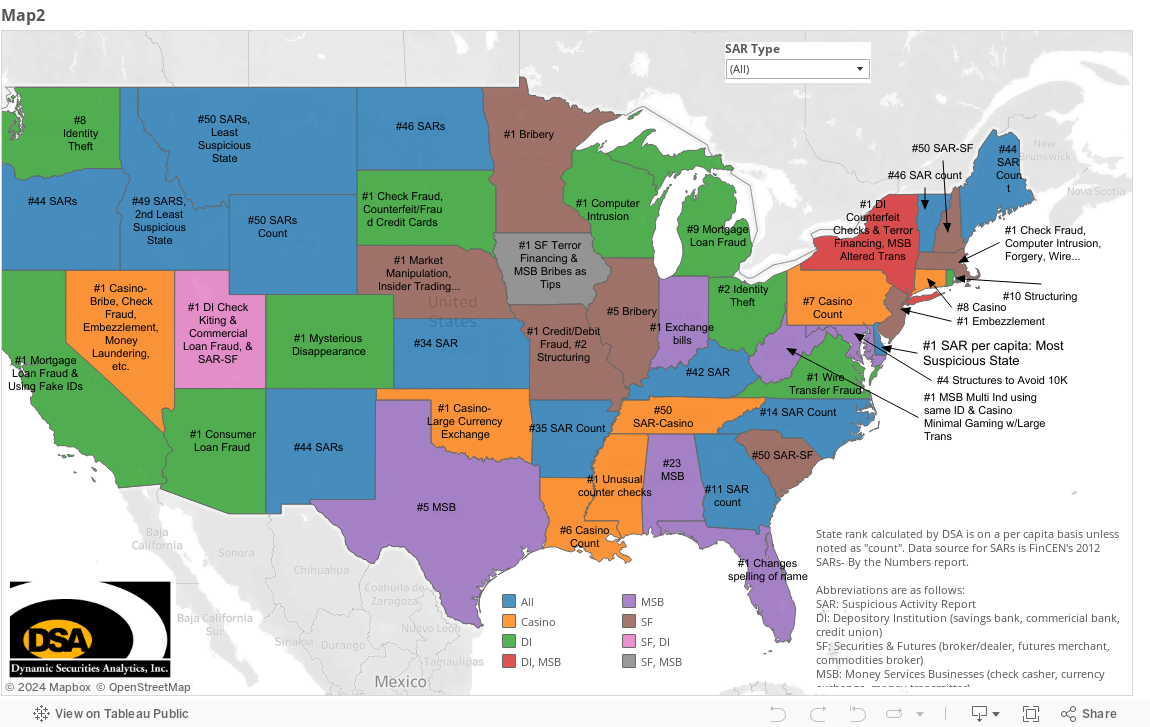
My goal was to create an interactive map of Suspicious Activity Reports (SARs) to determine what customer activity was reported as “suspicious” in each state. I planned to then declare that “Mississippi Tops the Ranks in ___ Fraud” and “Ohio is the Riskiest State for ____.” Instead, I was schooled in state law differences on usury, incorporation, and gambling. The resulting graphic is largely a map of the back-office locations of major financial institutions.
This did not come as a total surprise. I prepared a similar analysis of FinCEN’s SARs: By the Numbers report in 2009 and found the same problem. As I noted five years ago, the By the Numbers state data is not consistent. One transaction can have several states associated with it. For instance, a brokerage client in Florida may call his stockbroker in New York to place a suspicious trade which triggers an alert at the Omaha, Nebraska back-office.
South Dakota vs. North Dakota
For example, it is clear that despite South Dakota’s #1 ranking in many credit card fraud categories, the suspicious transactions are not taking place in South Dakota. The transactions may be processed or discovered in South Dakota because the state has usury laws conducive to credit card company back offices. Right next door, North Dakota is ranked #46 on credit card fraud. Similarly, Nebraska is the most suspicious state on a per capita basis for securities transactions like Insider Trading and Market Manipulation. What does this tell us? -that Nebraska is home to many financial services back-offices.
With all that in mind, Delaware takes the top spot as the overall Most Suspicious State. There was 1 SAR filed for every 10 residents. However, Delaware has more businesses than residents per a New York Times article.
Top Ranks
Despite the data reporting problems, there are some interesting findings when SARs per capita are analyzed:
- Colorado is #1 for “Mysterious Disappearance” at Depository Institutions
- Wisconsin is #1 for “Computer Intrusion” at Depository Institutions
- Oklahoma is #1 for “Large Currency Exchanges” at Casinos
- Illinois is #1 for “Exchanging Bills” at Money Services Businesses
- New Jersey is #1 for “Embezzlement” at Securities/Futures
Revised Format?
The 2013 FinCEN SARs: By the Numbers report has not been published yet. FinCEN stated that the report format is being revised and did not know when the new data will be available. Hopefully the revised format will address the problems noted above. I’ll close with a quote from my 2009 post on this topic:
Why is this important? The current methodology [for the By the Numbers report] is not useful or even worse, provides misleading information. The chief securities regulator for Florida could not use FinCEN’s report to justify a request for more examiners and a state legislator in Nebraska might think the state was awash with securities scammers. When FinCEN prepares and disseminates the report, it should be useful and reflect reality. The public, regulators, government officials, law enforcement, and compliance professionals rely on this data to make important decisions and they should have confidence in its accuracy.